Turbinia SRE Guide
Introduction
This document will cover topics to manage Turbinia infrastructure in cloud and includes Prometheus/Grafana monitoring stack how tos.
Cutting a new Turbinia release
If you are creating a new Turbinia release:
Update the version in
pyproject.tomland commit the change tomaster.Run
poetry lockto update dependencies and identify potential conflicts.Create a new release and tag on Github.
Publish the new release once all tests pass.
GCP
GCP management script: update-gcp-infra.sh
Preparation
The GCP stack is managed with the update-gcp-infra.sh management script. This script can be run from any workstation or cloud shell.
Stop and start the Turbinia stack
Turbinia uses Pub/Sub to distribute jobs and tasks to server and workers. We must first stop the server before stopping the workers. Before stopping the server we need to make sure the server is not handling any open tasks/requests anymore.
Stop infrastructure
Check the server logs to see if it’s waiting for any tasks to complete:
$ ./update-gcp-infra.sh -i
{INSTANCEID}
-z {ZONE} -c logs -s
NOTE
If you are not running from your workstation you can remove the
-s.If no tasks are open, shutdown the Turbinia infrastructure. The management script will make sure this is done properly.
$ ./update-gcp-infra.sh -i
{INSTANCEID}
-z {ZONE} -c stop
NOTE
Workers are shut down asynchronously so it will take a while to show them as “STOPPED”.
Start infrastructure
The management script will make sure startup is done in the correct order:
$ ./update-gcp-infra.sh -i
{INSTANCEID}
-z {ZONE} -c start
NOTE
workers are started up asynchronously so it will take a while to show them as “RUNNING”.
Check the server and worker logs to see if they came back up as expected.
$ ./update-gcp-infra.sh -i
{INSTANCEID}
-z {ZONE} -c logs -s
NOTE
If you are not running from your workstation you can remove the
-s.
Configuration update
The Turbinia configuration is base64 encoded as a metadata value (TURBINIA_CONF) attached to the GCE ContainerOS instances. This is written to disk at boot time and used by the server and worker docker containers.
Load the new configuration into the Turbinia stack with the following commands:
Environment variable update
The Turbinia stack (including monitoring components) sets some configuration parameters through containerOS environment variables.
Docker image update
Turbinia runs as a docker image (separate image for server and worker) that are built and stored in the osdfir-registry project. When you are ready to release a new version you need to reload the Turbinia stack with that new docker image. Please make sure you also update the configuration if needed (depending on code changes).
Update to latest
This is the most common scenario. When releasing a new version of Turbinia in
github, a production docker image will be built for both server and worker and
tagged with the latest tag.
Update the docker tag
Some scenarios require deploying a specific version of Turbinia. Each docker image is tagged with the actual release tag from github (eg 20210606) and can be loaded.
Stop the stack (see here).
Configure a custom tag (instead of
latest) for server and worker runnersVerify the required tag is actually successfully built and available in the registry for both server and worker.
$ ./update-gcp-infra.sh -i
{INSTANCEID}
-z {ZONE} -t [tag] -c change-image
Start the stack (see here).
When starting the stack again ContainerOS will poll the
osdfir-registryand pull thelatestimage of worker and server.Verify the running version by viewing the server and workers logs.
Spin-up more Turbinia workers
Sometimes we need more capacity to process tasks and we want to spin-up new workers.
Go to “VM instances” page under the Compute Engine tab in your cloud project.
Filter instances on the current Turbinia instance ID.
Only use the numbers, leave out the ‘turbinia-’ part.
Find the worker with the highest number at the end of the name (eg turbinia-worker-1aa1aaaa1a1a1111 -4)
Open the detail page of that worker.
Click the top button “Create Similar”.
Verify that the “Name” field correctly increased the last number in the name.
Scroll down and click “Create”.
Verify the logs of the new worker for correct instantiation.
$ ./update-gcp-infra.sh -i
{INSTANCEID}
-z {ZONE} -c logs -s
NOTE
If you are not running from your workstation you can remove the
-s.
Turbinia Metrics setup and management
Monitoring configuration
In order to interact with the current Turbinia Worker(s) and Server to generate metrics, you can include the following in Turbinia configuration file:
    # Prometheus monitoring config
    PROMETHEUS_ENABLED = True
    PROMETHEUS_ADDR = '0.0.0.0'
    PROMETHEUS_PORT = 9200
GCP setup
The following is the same for both prod and dev cloud projects.
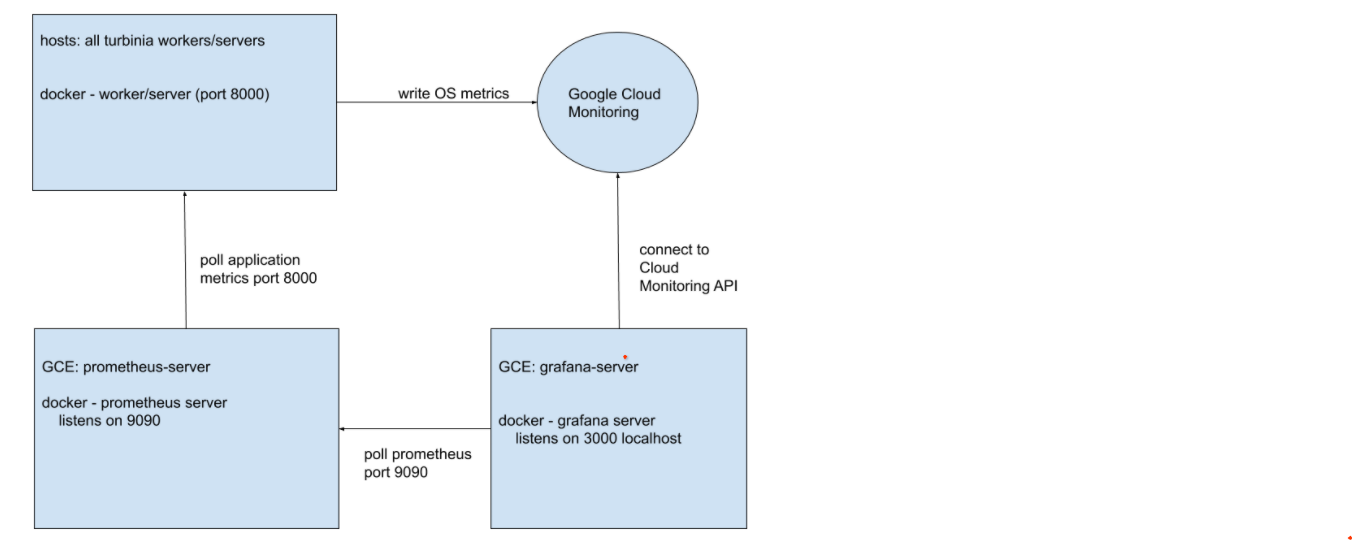 Google Monitoring metrics are enabled on all container machines and provide the OS
metrics.
Google Monitoring metrics are enabled on all container machines and provide the OS
metrics.
google-monitoring-enabledset totruein GCE configuration of container worker/server instances.All Turbinia machines are labeled with ‘turbinia-prometheus’ for auto-discovery by prometheus.
Turbinia server and workers are instrumented with prometheus code and expose application metrics.
each server and worker listens on port 9100 on the private IP only for system metrics and port 9200 for application metrics.
Prometheus
Prometheus will scrape the OS metrics and application metrics from each host and expose them on port 9090 for grafana
Listens on port 9090
Configuration:
/etc/prometheus/prometheus.ymland hereSSH:
ssh -i ~/.ssh/google_compute_engine -L 11111:localhost:9090 prometheus-server-1aa1aaaa1a1a1111
Dashboard is on https://localhost:11111/
As the server has a self signed cert, please use ‘thisisunsafe’ to continue past the error message.
Prometheus configuration GCP
global:
  scrape_interval: 15s # Set the scrape interval to every 15 seconds. Default is every 1 minute.
  # scrape_timeout is set to the global default (10s).
  external_labels:
      environment: turbinia-gcp_node

scrape_configs:
  - job_name: 'turbinia-gcp'
    gce_sd_configs:
        # The GCP Project
        - project: {PROJECT_NAME}
          zone: {ZONE}
          filter: labels.turbinia-prometheus=true
          refresh_interval: 120s
          port: 8000
The Turbinia hosts that need to be scraped have the label ‘turbinia-prometheus’ set by the Terraform scripts and are auto discovered by Prometheus.
Grafana
Grafana pulls metrics from Google monitoring (OS metrics) and application metrics from Prometheus.
Grafana displays dashboard for both the OS and Turbinia application metrics.
Datasource 1: Google Monitoring of gcp project
Datasource 2:
http://prometheus-server-1aa1aaaa1a1a1111:9090/Listens on port 3000
Current the username is “admin” and password is generated by terraform when it deploys Grafana.
WARNING: You are responsible for securely storing the Grafana admin password after terraform deployment is complete.
SSH access
ssh -i ~/.ssh/google_compute_engine -L 11111:localhost:3000 Grafana-server-1aa1aaaa1a1a1111
Dashboard is on https://localhost:11111/
As the server has a self signed cert, please use ‘thisisunsafe’ to continue past the error message
Importing a new dashboard to Grafana
Login to Grafana
Click the “+” sign on the left sidebar and then select “import”.
Then copy/paste the json file from the dashboard you want to import and click “Load”.
Exporting a dashboard from Grafana
Login to Grafana
From the dashboard, select the “dashboard Setting” on the upper right corner
Click on “JSON Model” and copy the contents of the textbox.
In order to import this to another dashboard, follow these steps.
How to update prometheus config
To update the prometheus config file or add new rules to prometheus:
SSH to the host VM as mentioned here .
To change the config:
Change and save the contents of
/etc/prometheus/prometheus.ymlRestart the prometheus container by running
docker restart {CONTAINER_ID}.To find the container_id run
docker ps.
To add new prometheus rules:
Create or update an existing rule file. Prometheus docs have great tips on how to write recording rules.
Update the config file
/etc/prometheus/prometheus.ymland add the path to the rule file underrule_filessection.Copy the rule file to the prometheus container by running
docker cp prometheus.rules.yml {CONTAINER_ID}:/etc/prometheus/prometheus.rules.ymlSSH to the prometheus container
docker exec -ti {CONTAINER_ID} shand check if the rule file is correct by running:promtool check rules rule_file_path
Finally to apply the rules, you need to send a
SIGHUPsignal to prometheus process by running:killall -HUP prometheus